

Abstract
In 2019, Syria experienced its largest outbreak of fires since 2003, when fire occurrence began to be monitored via the MODIS satellite instruments. Here, we combine remotely sensed data on fire, local climatic conditions, and vegetation with spatial data on violence, territorial control, and return of internally displaced persons (IDPs) to explore the underlying causes of Syria's fires at the sub-district, or ADM-3, level. We find evidence for a nuanced story: precipitation and stabilization in Kurdish-controlled territory fueled a bountiful wheat-growing year in 2019. This agricultural resurgence coincided with high fire activity, possibly revealing that people were attempting to jump-start agricultural livelihoods that were lost during the civil war. Restoration of labor forces from IDP returns was not a significant factor in this agricultural recovery. Meanwhile, most sub-districts outside Kurdish-controlled territory were free of fires, which explains the absence of a relationship between vegetation and fire. Thus, Syrian fire patterns in 2019 may be a signal of uneven stabilization, rather than destabilization.
Export citation and abstract BibTeX RIS
1. Introduction
In 2019, there were 118% more active fires in Syria compared to the next highest year since the modern satellite-based record began in 2003 (figure 1), with fire activity and density varying strongly across Syrian governorates (table A1). The cause of these fires was the subject of immense speculation, including assertions that the fires resulted from combat tactics of Islamic State of Iraq and Syria (ISIS) militants in the northeast, government usage of incendiary bombs on fields in Idlib, a lack of fire management, and unusually hot and dry weather (Parker 2019, Schoenborn 2019). Sly (2019) captures this confusion in one of her interviews, 'We cannot say who is doing it,' he [Jaghjagh] said. 'Is it Arabs? We cannot say. Is it Kurds? We cannot say. Is it the government? We cannot say. Is it Turkey? We cannot say. Is it foreigners? We cannot say. There are many enemies, and we have no proof.'

Figure 1. Monthly cumulative satellite active fire detections from the Aqua and Terra Moderate Resolution Imaging Spectroradiometer (MODIS) instrument MCD14ML product over Syria from 2003 to 2019. A description of the data is provided in the Methods section.
Download figure:
Standard image High-resolution imageAmidst all of this speculation, there have not been quantitative analyses to evaluate these claims, and, to our knowledge, there has been no work analyzing fire patterns for Syria in general. We address this gap with our own analysis of fire patterns in Syria and ask why there were such high fire levels in 2019, accounting for the amount and condition of fuel, and ignitions from the intentional use of fire in human activities (Pyne 1984), like agriculture. Specifically, we first use data since 2003 to determine the relationship between fire occurrences and climatic and agricultural factors in order to gain a baseline context of fire patterns and usage in Syria. Using this understanding of Syrian fire patterns, we then focus on which factors may account for the unusually high fire activity in 2019.
The abnormally high fire counts in 2019 suggest a role of factors beyond strictly natural variability in weather and fuel. While high temperatures in 2019 may have contributed to the fires, there is doubt that fires were driven by climatic factors alone (Sly 2019). Several additional possibilities have been hypothesized, and in a vacuum of clear explanations for abnormally high fire levels, unverified information in the form of rumors, conspiracy theories, and propaganda run rampant (Horowitz 2001, Schon 2020). Media accounts reported ISIS claims of starting fires as revenge toward other armed groups that ousted them from northeastern Syria, especially in predominantly Kurdish areas (Schoenborn 2019). ISIS claiming responsibility for an event, however, does not sufficiently prove its direct involvement. Rather, claiming an unrelated occurrence may simply serve its goal of destabilizing Syria (Byman 2016). Kurdish officials also blamed Turkey and the Syrian government for setting fires in order to undermine their self-administration project, whereas the Syrian government blamed Kurdish forces for the fires, based on the argument that the Kurdish-led Syrian Democratic Forces (SDF) was exacting retribution on farmers for selling wheat to the regime (Tarling and Ensor 2019).
In contrast to the above explanations involving destabilization, fires in 2019 may have been driven by stabilization. Natural resource extraction often increases in post-conflict contexts (e.g. Peru, Ivory Coast, Sri Lanka, and Nepal all had significant deforestation during post-conflict periods) (Grima and Singh 2019). Local populations often put economic activities on hold during conflict, and Syria has followed this pattern (Jaafar and Woertz 2016, Eklund et al 2017). Stabilization periods can then become times of intense environmental resource use (Dudley et al 2002). In Indonesia, studies have found fire to be used as a tool to boost agricultural livelihoods, with more fires in areas targeted for the creation of new districts (Edwards et al 2020), and during drier-than-normal dry seasons (Field et al 2016).
It is possible that as conflict slows, agricultural production increases, thereby increasing the use of fire. Burning helps farmers to clear waste after harvest, control weeds, pests and diseases, and to facilitate seedbed preparation for the following crop (Pala et al 2000, Virto et al 2007). In addition to Syria not exhibiting significant correlations between precipitation and fire counts in non-cropland regions (Abatzoglou et al 2018), we also doubt that precipitation is directly linked to fire counts in cropland regions. Variation in agricultural burning is a likely reason for variation in fire occurrence in cropland regions. Supporting this possibility from a nearby case, Ardakani et al (2010) examined fire in northern Iran from 2001 to 2008 and found that the fire season occurs from May to October, primarily in agricultural regions, and that the amount of fire was related to vegetation load. It is therefore plausible that agricultural industries could link conflict termination, or periods of stabilization, with environmental degradation (Falco et al 2019).
The Syrian case provides an example of an end-of-conflict situation, as the war is winding down. Current violence in Idlib has been seen for some time as the final offensive of the Assad government needed to effectively re-take the rest of the country (Mroue 2020). Moreover, Syrian agricultural output indicates a degree of stabilization with substantial increases in 2019. From 2018 to 2019, wheat cultivation roughly doubled to 1.26 million hectares, and barley cultivation grew by about 70% from 2018 to 2019 to 1.34 million hectares. While wheat production reached about 50% of pre-war levels, barley production approached pre-war levels (Food and Agriculture Organization 2020). The international community is justifiably monitoring threats to human security as the war winds down. At the same time, we believe that it is important to monitor threats to environmental security.
In this paper, we begin by describing our data. Our data include environmental and social variables, which we use to identify typical fire patterns in Syria and the changes in 2019—a year with an unusually high number of fires. We then assess the baseline relationships historically between precipitation, vegetation, and fire. After that, we examine pre-war burning practices by crop type. These steps allow us to precisely specify a regression model at the sub-district level as we analyze the underlying causes of Syria's fires in 2019.
2. Data
Our analysis of the drivers of fire patterns in Syria includes satellite data of fire activity, agriculture, vegetation, and weather, as well as measures of conflict, territorial control, and displacement. The analysis is multi-step, drawing on historical and time series data of weather, agriculture, and fire activity to build a regression model to test the importance of both natural and social factors in explaining anomalous fire activity in 2019.
2.1. Dependent variable: fire counts
To identify fire activity, we used active data from the Moderate Resolution Imaging Spectroradiometer (MODIS) instruments on board NASA's Terra and Aqua satellites, the combined record from which began in 2003. We used individual active fire pixels from the collection 6 MCD14ML product (Giglio et al 2016). Individual fire detections represent the center of a ∼1 km pixel where one or more fires were detected, after excluding non-fire thermal anomalies such as bright surfaces and sun glint. This method misses small fires, as well as those under thick clouds or outside of the overpass times, but the product is useful to compare relative amounts of fire activity over time or between regions. Active fire detections were counted each month in governorate (ADM-1) and sub-district (ADM-3)-level regions, using shapefiles from the United Nations Office for the Coordination of Humanitarian Affairs (OCHA) Humanitarian Data Exchange (OCHA 2019). Figure 2 displays these fire counts by sub-district, along with a map of Syria with the governorates labeled. These fires are primarily located in the north and northeastern governorates of Aleppo, Ar-Raqqa, Al Hasakeh, and Deir-ez-Zour, where outside of cities land is primarily used for growing crops 5 . Notably, the y-axes on figures 7 and 8 show that Al Hasakeh consistently experienced the most fires from 2003–2019, and figure 2 further highlights how Al Hasakeh experienced the most fires in 2019.
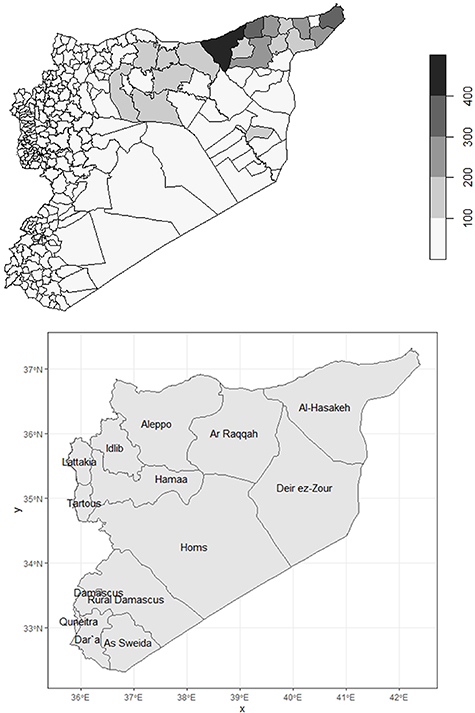
Figure 2. Fire counts in 2019 (top) and labeled governorates (bottom).
Download figure:
Standard image High-resolution image3. Independent variables: social and environmental factors
Our analysis of 2019 fire patterns in Syria includes a range of explanatory variables, which measure conflict, stabilization, and environmental conditions. We outline the variables and data sources below, with extended attention to the measurement and incorporation of the role of vegetation and agricultural burning in the methods and results sections.
To assess the relationship of fires to active conflict or particular combatant groups, we include measures of fatalities and territorial control. We account for the total number of fatalities in 2019 using the Uppsala Conflict Data Program (UCDP) Syrian violent events dataset records (figure 3). UCDP does not include Syria in their standard Geo-referenced Event Dataset (GED), due to the conflict being so fragmented that it does not meet the normal inclusion criteria. Instead, UCDP created a unique data release of violent events in Syria that extends from January 2016 to November 2019, using the same coding rules as for the GED (Sundberg and Melander 2013).
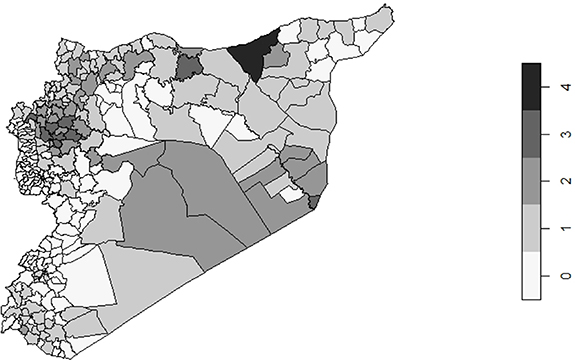
Figure 3. Total fatalities January–November 2019. 0 = 'No Fatalities', 1 = '0–100 Fatalities', 2 = '100–1000 Fatalities', 3 = '1000–10 000 Fatalities', and 4 = 'Over 10 000 Fatalities'.
Download figure:
Standard image High-resolution imageFor territorial control, we create binary indicators of which armed group controlled the largest amount of the sub-district, as of October 2018. This data comes from the Carter Center's compilation of open source material 6 . From November 2018 through 2019, territorial control was very stable in Syria, so we contend that territorial control as of October 2018 is a reliable indicator of territorial control in 2019. The measure classifies territories as being controlled by 'Government,' 'Opposition,' 'ISIS,' or 'Kurds.' Because ISIS had lost almost all of its territorial control by October 2018, we instead include an indicator of whether ISIS ever controlled the sub-district. This case is coded as one where ISIS controlled the sub-district at any time from January 2014 to October 2018, covering the full temporal range of the territorial control data. Our measure of 'Ever ISIS-Controlled' allows us to identify areas where ISIS sympathizers might be most prepared to attempt to destabilize Syrian communities by starting fires. We display these variables in figure 4.
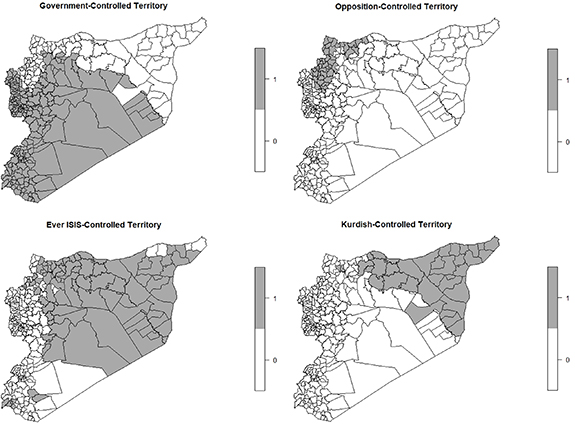
Figure 4. Territorial control.
Download figure:
Standard image High-resolution imageWe next examine the role of stabilization in increasing fire activity, specifically of the return of internally displaced persons (IDPs). IDP returns may serve to replenish agricultural labor forces and increase fire levels as a result of greater agricultural activity. Because IDP returns would need to precede fire activity, we use data on sub-district-level returns for the period August to December 2018 from the United Nations OCHA. IDP return data at the sub-district level is rare, so our ability to quantify IDP returns sub-nationally is unique. For these data, an inter-agency IDP task force, including both OCHA and UNHCR, interviews key informants and then triangulates as much information as possible (OCHA 2020). By January 2019, UNHCR alone had 520 staff—441 national staff and 79 international staff—dispersed across Syria, so there does appear to have been capacity to verify new information (UNHCR 2019). During this time period, over one million IDPs returned. If IDP returns were to affect fire levels in 2019, these returns at the end of 2018 should be significant. We display this variable in figure 5.

Figure 5. IDP returns August–December 2018.
Download figure:
Standard image High-resolution imageLastly, we incorporate the role of weather and agriculture, drawing on data sources for precipitation, vegetation, and agricultural production. Monthly precipitation over governorate (ADM-1) regions was calculated from the National Oceanographic and Atmospheric Administration Climate Prediction Center Global Unified Gauge-Based Analysis of Daily Precipitation (Chen et al 2008). To measure vegetation, we used monthly Normalized Difference Vegetation Index (NDVI) data from the MODIS instruments on board the NASA's Terra satellite as an indicator of fuel loads, following Ardakani et al (2010) and Jethva et al (2019). NDVI is derived from atmospherically-corrected surface reflectance of red (670 nm) and near-infrared (860 nm) wavelength bands retrieved by MODIS. The product we used, MOD13C2 (Collection 6, Level 3) (Didan 2015), is processed at a 0.05 by 0.05 degree resolution for monthly time intervals. NDVI is commonly used to monitor vegetation (Huete et al 2002), especially over low to medium biomass regions (Evrendilek and Gulbeyaz 2008), and is an effective proxy for crop production (Milesi et al 2010, Wardlow and Egbert 2010).
To determine fire location by cropped area, we use the Spatial Production Allocation Model (SPAM) 2010 v1.1 dataset, which includes the spatial distribution of global harvest area at five arc-minute spatial resolution for 42 crop types (International Food Policy Research Institute 2019). The dataset was created using a cross-entropy approach, which combines data from multiple sources and spatial scales (Yu et al 2020). These data include crop statistics, cropland extent, crop suitable area, farming-system information, irrigated area, and market access and price (to approximate farmers' crop choice). Combining data, SPAM produced estimates of the spatial distribution of crop types for circa 2010 (Yu et al 2020). Farmers may have chosen to switch crop types during the period between 2011 and 2019. We thereby use the SPAM data product to assess pre-war burning practices from 2009 to 2011. While crop types may change, burning practices for particular crops are unlikely to have changed.
4. Precipitation, vegetation, and fire in Syria
We begin by determining the historical relationship between precipitation and vegetation, as well as between vegetation and fire activity. These relationships are important to consider as they provide information on the role of climatic factors in driving changes in vegetation, as well as the importance of vegetation in driving historical observations of fire activity.
We observe in figure 6 that precipitation consistently leads NDVI by 2 months in four northeastern Syria governorates 7 . Figure 10 also shows that precipitation and NDVI have a strong correlation spatially at this 2 month lag 8 . This finding is consistent with expectations that NDVI would be strongly related to precipitation levels. This strong and consistent relationship between precipitation and NDVI suggests that vegetation varies seasonally, with an alignment of the agricultural and climatic calendars.

Figure 6. ADM1 Regional monthly mean NDVI retrieved by Tera's Moderate Resolution Imaging Spectroradiometer (MODIS) and ADM1 regional total monthly precipitation from the National Oceanographic and Atmospheric Administration Climate Prediction Center Global Unified Gauge-Based Analysis of Daily Precipitation for the 2003–2019 time period. Subfigure A is over Aleppo (SY02), B is over Al-Hasakeh (SY08), C is over Deir-ez-Zor (SY09), and Ar-Raqqa (SY11). In parenthesis are the ADM1 codes.
Download figure:
Standard image High-resolution imageIn figure 7, we observe that NDVI consistently leads fire occurrences. In combination with figure 1, we can observe that fire primarily occurs from May to September each year. NDVI is highest from January to April each year, aligning with crop growing seasons. These observations suggest that the link between vegetation and fire is observable if we consider the extent of crops from January to April, which then drives the extent of burning from May to September.
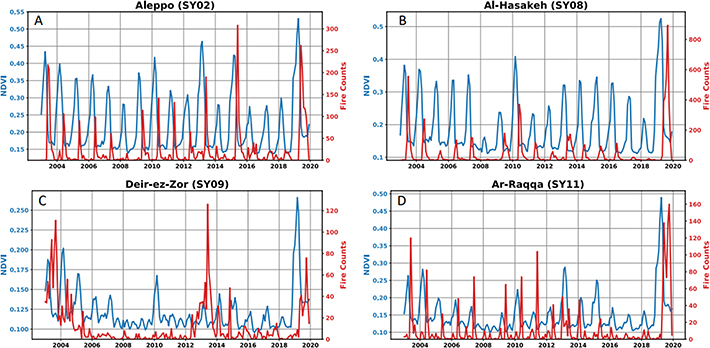
Figure 7. ADM1 Regional monthly mean NDVI retrieved by Tera's Moderate Resolution Imaging Spectroradiometer (MODIS) and ADM1 regional total monthly fire detections from the Aqua and Terra MODIS instrument MCD14ML product for the 2003–2019 time period. Subfigure A is over Aleppo (SY02), B is over Al-Hasakeh (SY08), C is over Deir-ez-Zor (SY09), and Ar-Raqqa (SY11). In parentheses are the ADM1 codes.
Download figure:
Standard image High-resolution imageKnowing this timing between vegetation and fire, we are then able to examine correlations between NDVI and fire occurrence. For the same four governorates, we display scatter plots in figure 8 with NDVI on the x-axis and fire occurrence on the y-axis. We also include lines of best fit for the correlation between NDVI and fire for 2003–2018. This highlights that Aleppo, Al-Hasakeh, and Ar-Raqqa had high levels of fire in 2019 that are not explained by NDVI, whereas NDVI had previously been strongly related to fire occurrence. Deir-ez-Zour deviates from the pattern of these three governorates. Deir-ez-Zour had unusually high fire levels in 2003 and 2013, whereas its fire levels in 2019 roughly fit the existing correlation between NDVI and fire from other years during the 2003–2019 period.

Figure 8. ADM1 Regional monthly mean NDVI retrieved by Tera's Moderate Resolution Imaging Spectroradiometer (MODIS) and ADM1 regional total monthly fire detections from the Aqua and Terra MODIS instrument MCD14ML product for the 2003–2019 time period. Subfigure A is over Aleppo (SY02), B is over Al-Hasakeh (SY08), C is over Deir-ez-Zor (SY09), and Ar-Raqqa (SY11). In parentheses are the ADM1 codes. Pearson correlation coefficients for 2003–2018, as well as lines of best fit that extend to 2019.
Download figure:
Standard image High-resolution imageTaken together, these analyses provide several important insights. First, precipitation and vegetation are strongly correlated with each other in Syria, with precipitation consistently leading vegetation by 1 or 2 months. Second, vegetation and fire are strongly correlated, with fire occurrence fluctuating based on the magnitude of that year's vegetation for most years. Third, we find that NDVI substantially under-predicts fire occurrence in Aleppo, Al-Hasakeh, and Ar-Raqqa governorates in 2019, indicating that other factors are likely involved with producing such high fire levels in these governorates in 2019. Based on these insights, we expand our analysis to build a regression model including a sub-district level measure of vegetation, as well as conflict-related measures of territorial control and violence.
5. Pre-war burning practices by crop type
To construct our regression model of 2019 fire activity, we turn to the use of fire in agricultural production. Accounting for the role of fire in agriculture and the timing of agricultural seasons allows for a more precise inclusion of NDVI values in the analysis. To determine the timing of vegetation to include in our regression, we first use historical data to identify which crops are associated with fire occurrence. Then, we use information on the growing calendars of those specific fire-related crops to identify the months during which the magnitude of NDVI is most relevant for fire activity.
To estimate crop type in fire locations, we identify pre-war agricultural land cover and compare it with fire locations in 2009–2011, corresponding to the SPAM data period. We assign a crop type to each 2009–2011 fire, using the SPAM dataset, in which each pixel has an estimate of the distribution of harvested area across 42 crop types. To assign crop types to individual active fires, we randomly assigned a crop to each active fire detection for 2009–2011, with the random selection weighted by the fractional coverage of each crop type in the underlying SPAM pixel. The distribution of fires across crop types was then estimated as the distribution of randomly assigned crop within each ADM unit. From this distribution, we identify which crop type predominantly had fires and, using their growing calendars, identify which months of vegetation measurements should be incorporated to explain 2019 fire levels. Our assumption with this approach is that, although agricultural activity and crop yields by type may have changed by 2019, the relative use of fire across crop types was the same.
Fire is most useful as an agricultural tool during harvest season, because it helps farmers clear their fields. In order to determine which timeframe of vegetation values to include in the regression analysis, we assessed whether fires predominantly occurred in areas growing particular crops using pre-war agricultural data to then incorporate pre-harvest NDVI values. We observe in figure 9 that cereals—especially wheat and barley—were the primary pre-war crops grown in Syria. This is true for Syria as a whole and for Raqqa, Deir-ez-Zour, Al Hasakeh, and Aleppo governorates specifically. Out of these governorates, figure 9 shows that Al Hasakeh experienced, by far, the most fires and Deir-ez-Zour experienced the fewest fires. Figure 9 displays the breakdown of crops grown (right) and the percentage of fires that occurred in areas with each crop type (left). From this figure, we clearly find that areas that have historically grown wheat experienced the largest share of fires. In addition, we find that areas that have historically grown barley experienced a disproportionately small percentage of fires.
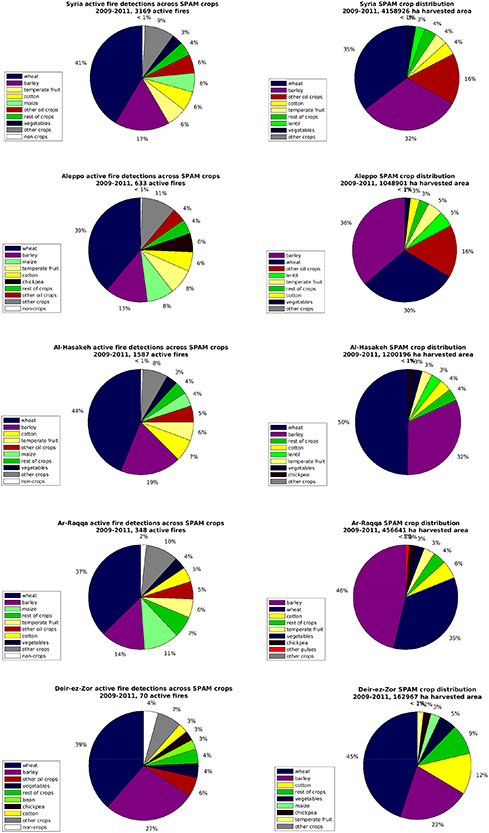
Figure 9. Fire detections by crop type (left) and crop distribution (right).
Download figure:
Standard image High-resolution imageDuring the civil war, wheat and barley production plummeted, but barley production returned to pre-conflict levels in 2019. Wheat production, on the other hand, roughly doubled from 2018 to 2019, although it still remained at about half of its pre-conflict production levels (Food and Agriculture Organization 2020). This analysis identifies that sub-districts that primarily grew wheat pre-conflict were disproportionately affected by fire in 2019. This pattern could occur due to the existence of particularly high benefits to wheat crop yields with burning, wheat fields being particularly susceptible to burning, or wheat being a cash crop that is a particularly valuable target for armed groups to destroy in order to weaken their enemies (Koren 2018, Martínez and Eng 2018).
Identifying wheat as the crop most closely associated with fires allows us to be more precise in our analysis of correlations between vegetation—measured by NDVI—and fire counts. According to FAO crop calendars, the harvest season for wheat extends from May to July in Syria (Food and Agriculture Organization 2020). The extent of burning during this time period should be related to the magnitude of vegetation in the growing season, roughly from January to April (figure 10). We therefore examine correlations between the maximum NDVI value for January to April of each year and the total fire counts for May to September (harvest season and immediately post-harvest).

Figure 10. NDVI max January–April 2019 (top) and precipitation max in mm/day November 2018–February 2019 (bottom).
Download figure:
Standard image High-resolution imageAs figure 11 shows, there is a positive correlation between maximum NDVI value for January to April and total fires from May to September across Syrian governorates.
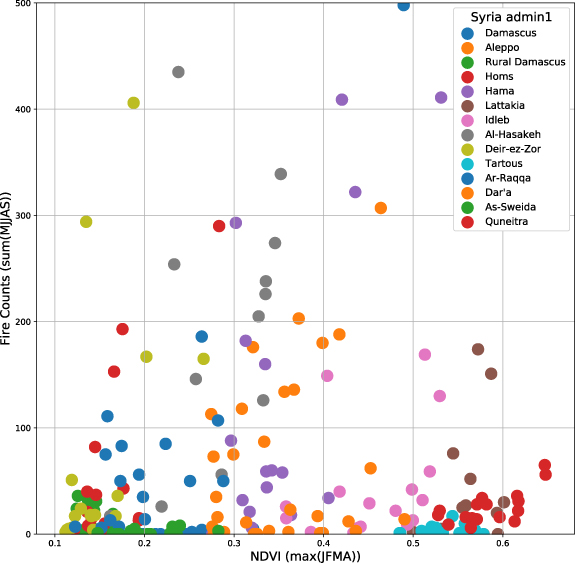
Figure 11. Maximum NDVI value for January–April from Tera's Moderate Resolution Imaging Spectroradiometer (MODIS) correlated to total active fire detections for May–September, retrieved from MODIS Terra and Aqua's combined satellite product over Syria ADM1 unit from 2003 to 2019. A description of the data is provided in the Methods section.
Download figure:
Standard image High-resolution imageAfter identifying the relationship between precipitation and NDVI, the fire distribution by crop type, and the crop-appropriate timing of vegetation measures, we conduct a series of cross-sectional regressions of Syria's sub-districts (n = 272). Our dependent variable measures the total number of fires in each sub-district for all of 2019, and our independent variables include maximum NDVI during agriculturally relevant months, as well as indicators of fatalities, territorial control, and IDP returns.
6. Explaining unusually high fire levels in 2019
Even after accounting for the positive correlation between NDVI and fire, as well as high precipitation levels in 2019, the fire levels in 2019 were unusually high. This leads us to consider the role of conflict factors. On the one hand, media accounts portrayed fires in 2019 as a sign of destabilization. On the other hand, a growing body of research suggests that high fire levels, among other forms of land management or environmental degradation, could be a sign of stabilization. To examine these possibilities, we conduct a cross-sectional analysis of the 272 sub-districts in Syria. We estimate linear regression models of fire that include NDVI as an independent variable, as well as indicators of fatalities, territorial control, and IDP returns. Then, we compute two additional regressions with terms measuring the interaction of vegetation and Kurdish territorial control, as well as fatalities and Kurdish territorial control. These interaction terms allow us to observe whether the NDVI-fire relationship varies based on which armed group controls the territory. For our regression analysis, we estimate the following linear regression models:
- (a)Fire2019 = NDVIMAX_spring + Returns2018 + Gov10/2018 + Fatalities2019 +

- (b)Fire2019 = NDVIMAX_spring + Returns2018 + ISISever + Fatalities2019 +
- (c)Fire2019 = NDVIMAX_spring + Returns2018 + Opp10/2018 + Fatalities2019 +
- (d)Fire2019 = NDVIMAX_spring + Returns2018 + Kurds10/2018 + Fatalities2019 +
- (e)Fire2019 = Kurds10/2018 + NDVIMAX_spring + Kurds10/2018 × NDVIMAX_spring + Returns2018 + Fatalities2019 +
- (f)Fire2019 = NDVIMAX_spring + Returns2018 + Kurds10/2018 + Fatalities2019 + Kurds10/2018 × Fatalities2019 +
We display regression results in table 1. These results show that fire levels in 2019 were higher in sub-districts that were more violent, had higher NDVI levels, or were controlled by Kurdish forces (specifically the SDF by 2019). There are only four sub-districts that have never been controlled by ISIS and are currently controlled by the Kurds. These are all in the northeast corner of Syria, in Al Hasakeh province.
Table 1. Linear regression results.
| Dependent variable: | ||||||
|---|---|---|---|---|---|---|
| 2019 fire counts | ||||||
| (1) | (2) | (3) | (4) | (5) | (6) | |
| NDVI | 51.581** | 68.603*** | 68.979*** | 46.280** | 10.238 | 49.918*** |
| (18.374) | (18.108) | (18.668) | (14.666) | (14.013) | (13.997) | |
| 2019 fatalities | 0.016*** | 0.018*** | 0.020*** | 0.016*** | 0.016*** | 0.004 |
| (0.002) | (0.002) | (0.002) | (0.002) | (0.002) | (0.003) | |
| IDP returns | −0.00001 | −0.00003 | −0.0001 | −0.00001 | −0.00000 | −0.00001 |
| (0.00004) | (0.00004) | (0.00004) | (0.00003) | (0.00003) | (0.00003) | |
| Government territory | −32.496*** | |||||
| (6.555) | ||||||
| Ever ISIS territory | 32.653*** | |||||
| (6.035) | ||||||
| Opposition territory | −29.351*** | |||||
| (8.111) | ||||||
| Kurdish territory | 93.800*** | −78.926*** | 87.511*** | |||
| (6.889) | (22.910) | (6.674) | ||||
| NDVI × Kurdish territory | 334.272*** | |||||
| (42.674) | ||||||
| Fatalities × Kurdish territory | 0.020*** | |||||
| (0.004) | ||||||
| Constant | 16.589 | −25.598** | −9.580 | −15.955* | 1.151 | −15.741* |
| (10.901) | (9.567) | (9.497) | (7.455) | (7.074) | (7.107) | |
| Observations | 270 | 270 | 270 | 270 | 270 | 270 |
| R2 | 0.278 | 0.290 | 0.248 | 0.536 | 0.623 | 0.580 |
| Adjusted R2 | 0.267 | 0.279 | 0.237 | 0.529 | 0.616 | 0.572 |
Note:* p < 0.05 ** p < 0.01 *** p < 0.001
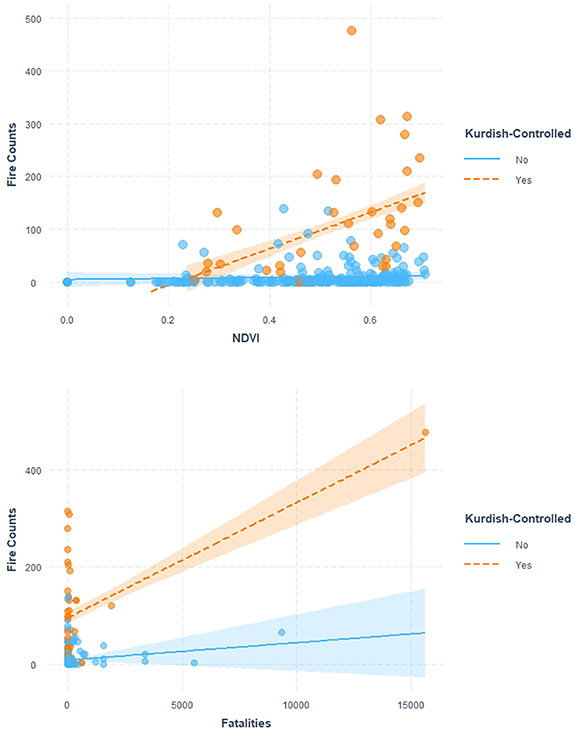
Furthermore, we observe that the positive relationship between NDVI and fire counts does not exist across all of Syria. The relationship specifically exists within Kurdish-controlled territory. While figure 8 shows that the NDVI value for Al Hasakeh governorate as a whole under-predicts its fire occurrence in 2019, our regression results at the sub-district level show that within-governorate variation in vegetation can effectively explain variation in fire levels, at least for Al Hasakeh. Figure 12 displays lines of best fit from Model 5 and Model 6 of table 1, with the scatter plot of data points overlaid. In addition to the crucial distinction that there is only a positive relationship between NDVI and fire counts in Kurdish-controlled territory, we also observe that most sub-districts that are not controlled by Kurdish forces did not experience any fires, regardless of NDVI levels.
Figure 12. Predicted fires by Kurdish-controlled territory and NDVI, ADM-3 (top) and by Kurdish-controlled territory and fatalities, ADM-3 (bottom).
Download figure:
Standard image High-resolution image
While table 1 indicates that there were higher fire counts in sub-districts with more violence, further examination of this relationship shows that two sub-districts in Kurdish-controlled territory with high fatality counts drive the correlation, as figure 12 illustrates (based on Model 6). We therefore doubt whether there is a systematic relationship between insecurity and fire counts. Despite portrayals of Syria's 2019 fires as a sign of destabilization, we do not find strong evidence to support claims of destabilization increasing fire counts.
It is important to note that IDP returns is not a significant explanatory factor for fire counts. The absence of a significant relationship between return migration and fire counts suggests that our two suggested mechanisms—return being a proxy for stabilization that leads to fire and return increasing the size of the labor force that can set fires—do not have empirical support. First, stabilization and return migration do not have a straightforward relationship. For example, return migration may require enough stabilization to increase security to a satisfactory level, as well as economic opportunities for returnees (Camarena and Hägerdal 2020). Second, fire counts in Syria may not be particularly responsive to the size of the agricultural labor force, especially in wheat-growing areas where production is highly mechanized (Food and Agriculture Organization 2018).
This analysis provides an explanation for the unusually high fire levels in Al Hasakeh in 2019 (high NDVI levels in some sub-districts), but there remains a need to consider why Aleppo and Ar-Raqqa had such high fire levels. We are unable to specify a precise answer for these governorates, but one report from the United Nations Security Council suggests that explosive ordnance may be an important part of the explanation 9 . Another report found that explosive ordnance blocks access to agricultural land in approximately 30% of surveyed communities in Aleppo governorate (Smale et al 2020). Such high levels of explosive material create a very high risk of crop fires, as people take risks to pursue their agricultural livelihoods. Furthermore, it is possible that bombs are less likely to detonate when they hit softer, more fertile ground, which could leave larger quantities of explosive ordnance sitting in more fertile and agriculturally productive areas (Lin 2020). This challenge of dealing with explosive material around agricultural land does not appear to be as much of a problem in Al Hasakeh, so it could be a driver of fire that primarily affects Aleppo and Ar-Raqqa. More data is needed, however, to more thoroughly investigate this possibility.
7. Discussion
While conflict saturates news from Syria, there are many other important dynamics at play. In 2019, some news coverage circulated internationally about unusually high fire levels in Syria, but even this story faded quickly. We examine this anomaly because it provides an opportunity to expand our understanding of drivers of fire activity and the role of fire in agriculture, conflict, and the rural economy of Syria.
Fire produces important environmental concerns, but high fire counts in 2019 could actually be interpreted as a sign of stabilization and re-development in many sub-districts, particularly Kurdish-controlled sub-districts in Al Hasakeh where the largest number of fires occurred. Looking at environmental drivers of fire prior to the onset of conflict in 2011, we see that years with higher precipitation tended to yield more vegetation. In such high precipitation and NDVI years, increased fire counts would then be high due to the normal agricultural practice in Syria of burning of this increased fuel load during harvest season. From 2018 to 2019, production of wheat and barley, Syria's two leading crops, almost doubled. This increase was fueled by high precipitation in 2019, but the high agricultural productivity of 2019 is also a very encouraging indicator of stabilization for the country. Amidst the immense challenges that remain for Syria, this stabilization is critical.
In examining 2019 fires, the highest fire counts occurred in Kurdish-controlled sub-districts with high NDVI values. Given historical relationships between fire activity and wheat cultivation, this relationship between vegetation and fire in Kurdish territories can be interpreted as an encouraging signal of agricultural renewal from end-of-conflict stabilization, as opposed to a sign of continuing insecurity.
The lack of a positive correlation between NDVI and fire in sub-districts outside Kurdish-controlled territory, meanwhile, reveals that the stabilization in 2019 was uneven. Areas under government control, opposition control, and/or with an ISIS presence outside Kurdish-controlled territory do not exhibit a relationship between NDVI and fire. The possibility of explosive ordnance driving high fire levels in Aleppo and Raqqa governorates adds to this story of uneven stabilization. While ISIS has dominated news headlines and has expressed a desire to link fire with destabilization, it is critical to emphasize that fire in Syria is more likely to be linked with stabilization.
Acknowledgments
The authors acknowledge support from the Army Research Office/Army Research Laboratory. Theresearch was supported in part by the Army Research Office/Army Research Laboratory under Award No. W911NF1810267 (Multidisciplinary University Research Initiative). MJP and KM also acknowledge support from the Defense Advanced Research Project Agency (DARPA) under the World Modelers program (Grant W911NF1910013). RDF acknowledges the support of the NASA Applied Sciences Group on Earth Observations Work Programme (NNH16ZDA001N-GEO). The views and conclusions contained in this manuscript are those of the authors and should not be interpreted as representing the official policies either expressed or implied of the Army Research Office or the US Government.
Data availability statement
The data that support the findings of this study are available upon reasonable request from the authors.
: Appendix
Table A1. Annual Aqua and Terra MODIS active fire counts over Syrian governorates.
| SY01 | SY02 | SY03 | SY04 | SY05 | SY06 | SY07 | SY08 | SY09 | SY10 | SY11 | SY12 | SY13 | SY14 | ||
|---|---|---|---|---|---|---|---|---|---|---|---|---|---|---|---|
| ADM1 ID | 1 | 199 | 265 | 432 | 111 | 24 | 54 | 232 | 252 | 19 | 176 | 38 | 64 | 17 | Syria |
| Area (1oo km2) | Damascus | Aleppo | Rural Damascus | Homs | Hama | Lattakia | Idleb | Al-Hasakeh | Deir-ez-Zor | Tartous | Ar-Raqqa | Dar'a | As-Sweida | Quneitra | 1884 |
| 2003 | 0 | 529 | 11 | 13 | 38 | 10 | 42 | 974 | 679 | 5 | 204 | 1 | 1 | 30 | 2537 |
| 2004 | 0 | 215 | 6 | 17 | 18 | 16 | 8 | 574 | 281 | 4 | 134 | 5 | 1 | 18 | 1297 |
| 2005 | 0 | 149 | 6 | 40 | 7 | 2 | 1 | 149 | 94 | 3 | 48 | 1 | 5 | 29 | 534 |
| 2006 | 0 | 162 | 5 | 10 | 45 | 8 | 25 | 269 | 33 | 10 | 82 | 2 | 1 | 39 | 691 |
| 2007 | 0 | 109 | 10 | 11 | 26 | 92 | 9 | 373 | 19 | 14 | 93 | 1 | 2 | 21 | 780 |
| 2008 | 1 | 28 | 9 | 9 | 0 | 18 | 2 | 35 | 21 | 1 | 22 | 0 | 1 | 9 | 156 |
| 2009 | 1 | 229 | 3 | 29 | 61 | 0 | 19 | 500 | 13 | 4 | 97 | 0 | 0 | 35 | 991 |
| 2010 | 0 | 200 | 2 | 18 | 64 | 5 | 32 | 814 | 35 | 3 | 103 | 4 | 10 | 109 | 1399 |
| 2011 | 0 | 204 | 4 | 16 | 59 | 0 | 9 | 273 | 22 | 1 | 148 | 3 | 0 | 40 | 779 |
| 2012 | 0 | 157 | 11 | 52 | 33 | 448 | 156 | 168 | 133 | 4 | 72 | 3 | 0 | 10 | 1247 |
| 2013 | 1 | 380 | 46 | 197 | 336 | 203 | 141 | 710 | 466 | 15 | 157 | 20 | 1 | 66 | 2739 |
| 2014 | 0 | 79 | 23 | 53 | 89 | 46 | 19 | 242 | 130 | 6 | 80 | 7 | 0 | 36 | 810 |
| 2015 | 4 | 630 | 32 | 229 | 416 | 173 | 67 | 292 | 55 | 12 | 76 | 63 | 8 | 38 | 2095 |
| 2016 | 0 | 164 | 42 | 439 | 319 | 165 | 31 | 226 | 43 | 42 | 29 | 11 | 5 | 28 | 1544 |
| 2017 | 2 | 107 | 38 | 1645 | 188 | 31 | 41 | 72 | 66 | 5 | 24 | 17 | 0 | 23 | 2259 |
| 2018 | 0 | 91 | 31 | 29 | 163 | 30 | 31 | 36 | 16 | 12 | 31 | 23 | 4 | 20 | 517 |
| 2019 | 5 | 962 | 23 | 332 | 442 | 69 | 185 | 2794 | 314 | 10 | 763 | 21 | 4 | 42 | 5966 |
| Total | 14 | 4395 | 302 | 3139 | 2304 | 1316 | 818 | 8501 | 2420 | 151 | 2163 | 182 | 43 | 593 | 26 341 |
| Total fires per km2 | 0.12 | 0.22 | 0.01 | 0.07 | 0.21 | 0.55 | 0.15 | 0.37 | 0.10 | 0.08 | 0.12 | 0.05 | 0.01 | 0.34 | 0.14 |
Footnotes
- 5
See for example (Accessed 13 January 2021): https://maps.elie.ucl.acbe/CCI/viewer/
- 6
See Carter Center, 'Syria Conflict Mapping,' (Accessed 22 September 2019): www.cartercenter.org/peace/conflict_resolution/syria-conflict-resolution.html
- 7
The 2 month lag is estimated using a peak detection algorithm with filtering to match the closest peak in precipitation to NDVI. There is some variation across governorates, but this analysis shows that a two month lag is consistently the most appropriate lag length.
- 8
Some Syrian sub-districts were too small to pick up a distinct precipitation value, so the map shows some variation that does not actually exist. In reality, there is a smooth pattern of lower levels of precipitation in the south and east of Syria and higher values of precipitation as one moves north and west.
- 9
Report of the Secretary-General [S/2019/674], 21 August 2019, p 5.